
Historical farm data
We track both alive and dead animals across production, milk-test and herd-event records over time to analyse the rate of change.
MooNitoring brings your livestock book into one map: where risk is concentrated, and how it changes farm by farm, so you can select, price and monitor each farm on its own history.
MooNitoring Farm Risk Map
The map follows every farm in the portfolio over time. With one shared rate, they all receive the same risk expectation.
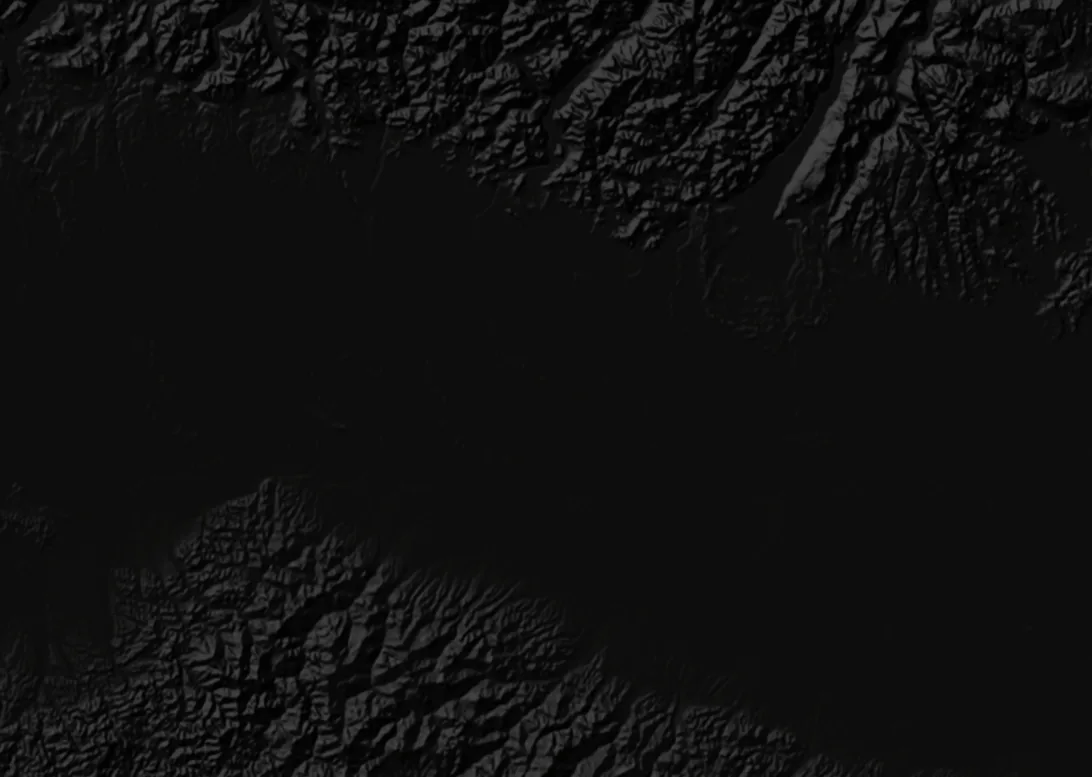
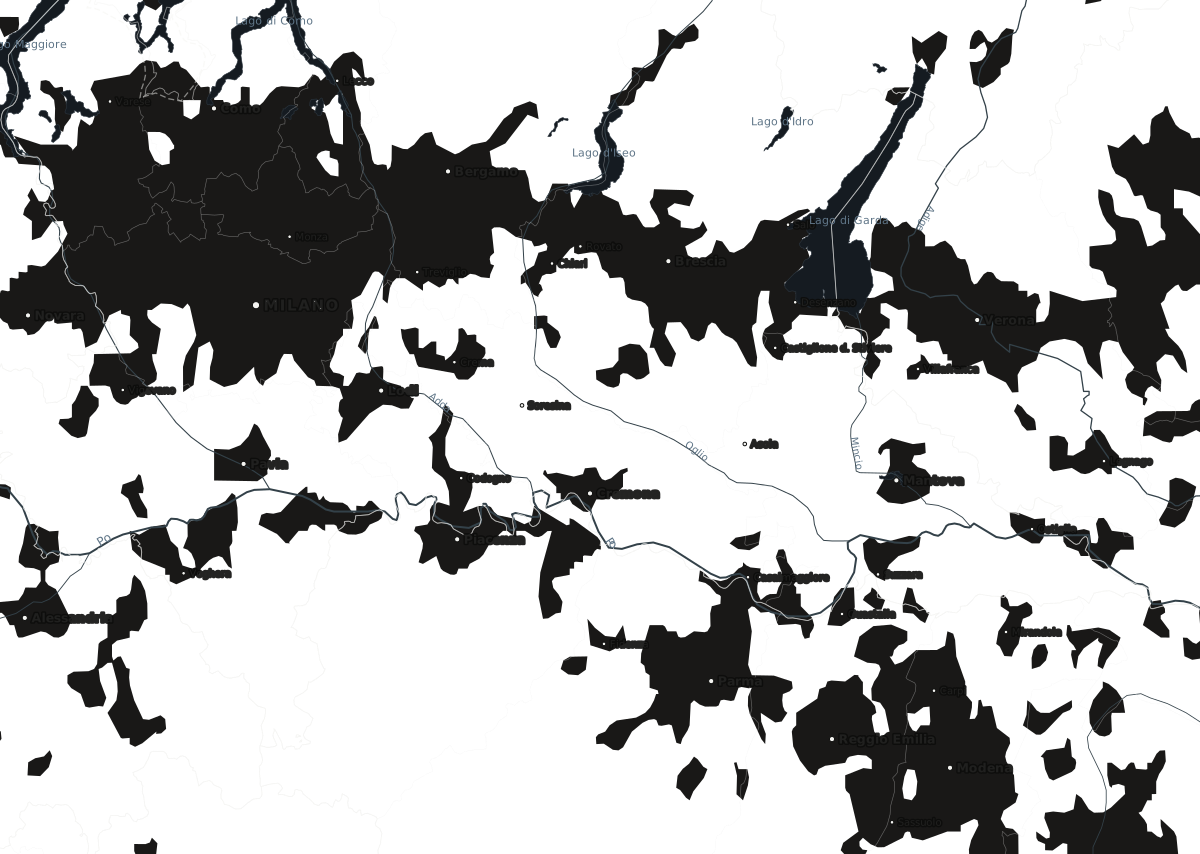
2025 REPLAY · JAN–AUG
Why this works
Farm systems instead record production, milk tests, lifecycle events, treatments and exits over months and years. That sequence can show farm differences that a shared average misses.
It can also reveal what happened before a severe event, without claiming that the data proves its cause.
Dates, source references and derivation rules stay attached.
The evidence
We compared predictions for six farms in 2025 with predictions based on the portfolio average. Shorter bars mean more accurate predictions.
Average miss, head of cattle
Average miss, head of cattle
Average miss, kg per head per day
Lower prediction error on each farm means better selection, better pricing, and earlier warnings. That is how we expect to help you improve loss ratios.
This is possible thanks to 73 cow-level features that we map and combine using our proprietary models.
| Target | Unit | MooNitoring | Baseline | Reduction | Farms with lower error |
|---|---|---|---|---|---|
| Mortality | Average miss, head of cattle | 21.58 | 40.31 | 46.5% | 5 of 6 |
| Chronic mastitis | Average miss, head of cattle | 13.95 | 44.45 | 68.6% | 6 of 6 |
| Production | Average miss, kg per head per day | 1.46 | 4.40 | 66.7% | 6 of 6 |
The data product
We track both alive and dead animals across production, milk-test and herd-event records over time to analyse the rate of change.
Our technology processes and transforms data from different software and farms into a single source of truth.
Records retain their source, date, animal identity, derivation rule and quality status so that you can verify the original data.
We combine multiple domains of the dairy science and machine learning to detect fraud.
How we can work together
We define the goal together: the risk or loss you want to see differently, and the decision it would change. You bring the underwriting perspective; we bring our domain knowledge.
We contact the farmers and run the research against their dataset. Since no new hardware is involved, we can manage everything remotely.
We show you what the data supports and how it can improve the underwriting. If it does not support your use case, we say so in plain terms.
FAQ
Dairy models to test against your portfolio. The approach is designed to help insurers improve loss ratios by assessing each farm on its own history.
We understand what your needs are and how we can help you, and set the success criteria.
We scope the timeline in the working session and commit to it there. It depends on the question, so we do not publish a number we might miss.
A repeated temporal backtest for 2025: models selected and trained only on data through 2024, forecasts sealed, then compared against observed outcomes on six farms.
Connected farms are Italian but the data model is designed to extend across European and US dairy markets.